Technical indicators play an important role in trading, and particularly in day trading. Indicators provide deeper insight into price movements and give traders the information they need to identify potential setups and make trading decisions.
While there are hundreds of different technical indicators available, you can start trading by understanding how just a few of the most popular indicators work. In this guide, we’ll explain why you might use technical indicators and highlight some of the best technical indicators for day trading.
What is a Technical Indicator?
A technical indicator is simply a mathematical formula. Most technical indicators use past price data or other trading-related variables like volume to calculate a number. The number produced by a technical indicator can be calculated repeatedly for different time intervals and the results displayed on a chart.
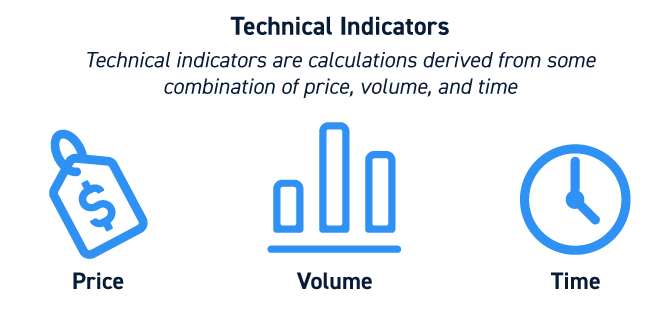
For example, a simple technical indicator is a moving average. This calculates the average price of an asset over the last X time periods. Calculating a moving average from the current time period, the previous time period, and so on results in a string of moving averages going back in time, which can then be plotted to form a line.
Goals of Technical Indicators
Technical indicators serve several purposes in trading.
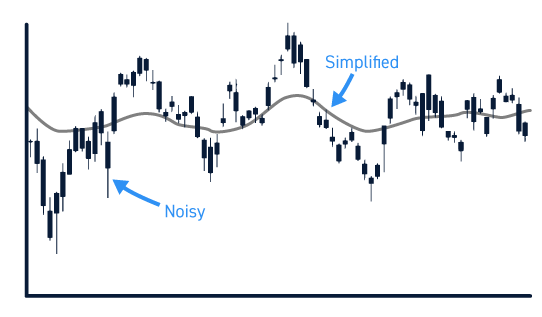
First, they serve to simplify complex data. Price data is often messy and hard to interpret on its own, but technical indicators offer an alternative way to compress and visualize that data. Different technical indicators provide different windows into how an asset’s price is moving.
In addition, technical indicators can help traders identify significant price points, such as areas of support or resistance. They can also identify price points that might not be obvious just from looking at a chart, but which could serve as new price levels after a breakout or breakdown.
Technical indicators can also help traders identify potential reversals before they happen. Some indicators serve to locate areas of resistance where a reversal could occur, while others look at price momentum to indicate whether a reversal is likely to happen.
Considerations Before Using Technical Indicators
Day traders are bombarded with hundreds of different technical indicators and an overwhelming number of options for how to use them in combination. This can make it tempting to use as many indicators as possible in your trading.
However, it’s important that you not use indicators just because they’re available. Rather, every technical indicator you use should contribute to your decision-making process. If you don’t understand a specific indicator or find that it’s not helping you evaluate trades, then don’t use it.
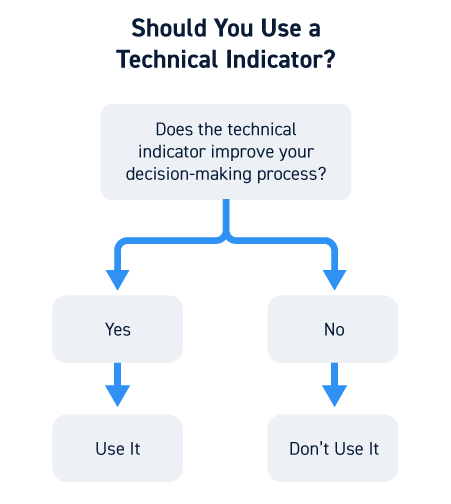
When in doubt, remember that every trader uses different indicators. It’s up to you to find the ones that are most effective for your trading strategy and that help rather than hinder your trading.
Best Technical Indicators for Day Trading
With those considerations in mind, let’s take a closer look at some of the most popular technical indicators you can use for day trading.
VWAP
VWAP, or volume-weighted average price, is perhaps the single most widely-used technical indicator among day traders. VWAP is useful because it looks at both price and trading volume.
VWAP is calculated by finding the average price of an asset over a given period and multiplying by the trading volume over that period. This number is then divided by the cumulative volume over the entire trading day up to the current period.
Institutional traders often use VWAP to determine when to trade so that they move the price of an asset as little as possible. So, prices tend to move back towards the VWAP when institutional traders are active. In the absence of other activity, you could buy when the price is below the VWAP or sell when the price is above the VWAP.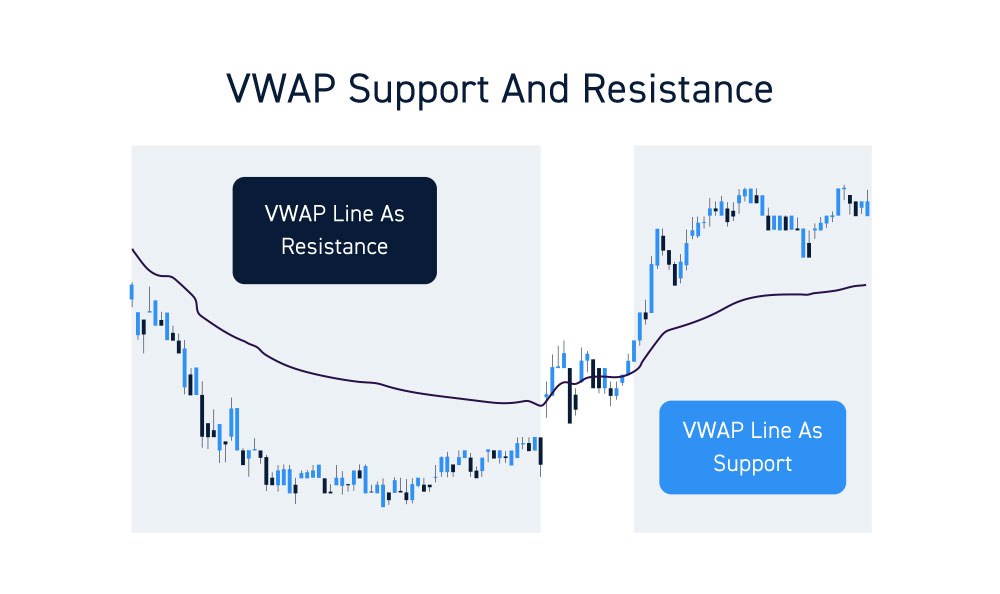
VWAP is also used to determine support and resistance levels throughout the day.
Moving Averages
Moving averages and VWAP have a lot in common, but moving averages don’t account for trading volume. Rather, they look only at the average price of an asset over a specified look-back period.
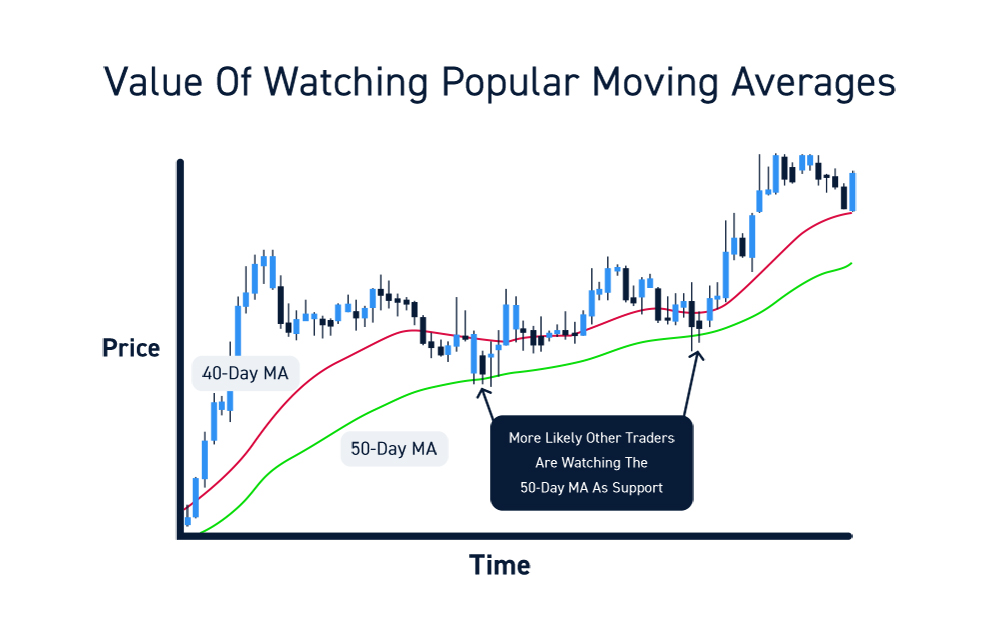
Common look-back periods for day traders include 10, 20, 50, and 200 bars (those may be 1-minute, 15-minute, hourly, or daily bars). A shorter moving average period gives information about short-term price action, while a longer moving average period smooths out long-term volatility and can be useful for identifying support and resistance levels. You can also look for periods when short- and long-term moving averages cross to see whether recent price action is bullish or bearish.
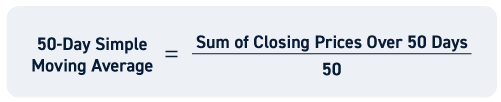
It’s important to note that there are actually two types of moving averages commonly used by day traders: the simple moving average (SMA) and the exponential moving average (EMA). The SMA just takes the average of all prices in the look-back period, assigning the same weight to the oldest and most recent price points in the calculation. The EMA assigns more weight to more recent price points in the calculation, so it is more responsive in volatile market conditions.
Momentum Oscillators
Momentum oscillators are a class of several technical indicators that measure an asset’s price momentum. Two of the most popular momentum oscillators are the relative strength index (RSI) and the stochastic oscillator.
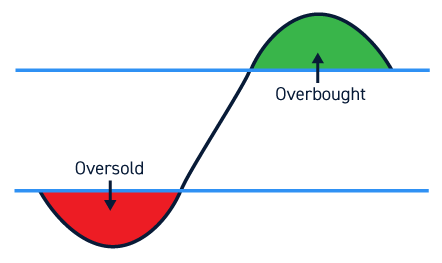
RSI has a value from 0 to 100 and is easy to interpret. When RSI is greater than 70-80, an asset is thought to be overbought. When RSI is less than 20-30, it is thought to be oversold. However, keep in mind that an asset with strong momentum can stay overbought or oversold for a long time, so RSI should not necessarily be used as a trading signal on its own.
The stochastic oscillator also ranges from 0 to 100 and consists of two lines – %K, a fast-moving oscillator, and %D, a moving average of %K that responds more slowly to price action. The stochastic oscillator has overbought and oversold levels just like RSI, but traders can also get information about directional changes in momentum by watching for crossovers between the %K and %D lines.
MACD
MACD, or moving average convergence divergence, is another momentum indicator frequently used by day traders. The MACD is calculated by subtracting an asset’s 26-period EMA from its 12-period EMA, so in effect it is the difference between slow-moving and fast-moving moving averages. In addition, another line, called the signal line, is plotted on top of MACD. The signal line is a 9-period moving average of the MACD.
The MACD can be used and interpreted in several ways, but the most common application is to look for moments when the MACD crosses its signal line. An upward cross (that is, the MACD line crossing from below to above its signal line) is a bullish trade signal, while a downward cross is a bearish signal.
Conclusion
Technical indicators can help day traders make sense of complex price information and identify patterns that are suitable for trading. When choosing what indicators to use, it’s important to make sure that each technical indicator you look at is contributing to your decision-making. For new day traders, VWAP, moving averages, RSI, stochastics, and MACD are excellent indicators to get started with.