All traders have experienced missing an incredible move in the market, only to wonder whether the stock will continue the push or reverse trend. FOMO might drive a new trader to jump in on the move, hoping for a meteoric rise, while indecision on entry points might make them miss the move altogether.
On the other hand, experienced, professional traders rely upon hard rules to govern their trading entries and exits. Among the various technical chart patterns in their toolboxes lies the bull flag chart pattern, which is also one of the most common.
This pattern is reliable, consistent, and common. It is found anywhere from the daily chart to the 5-minute chart, and as such, it is a pattern that all traders should be aware of.
What is a Bull Flag Chart Pattern?
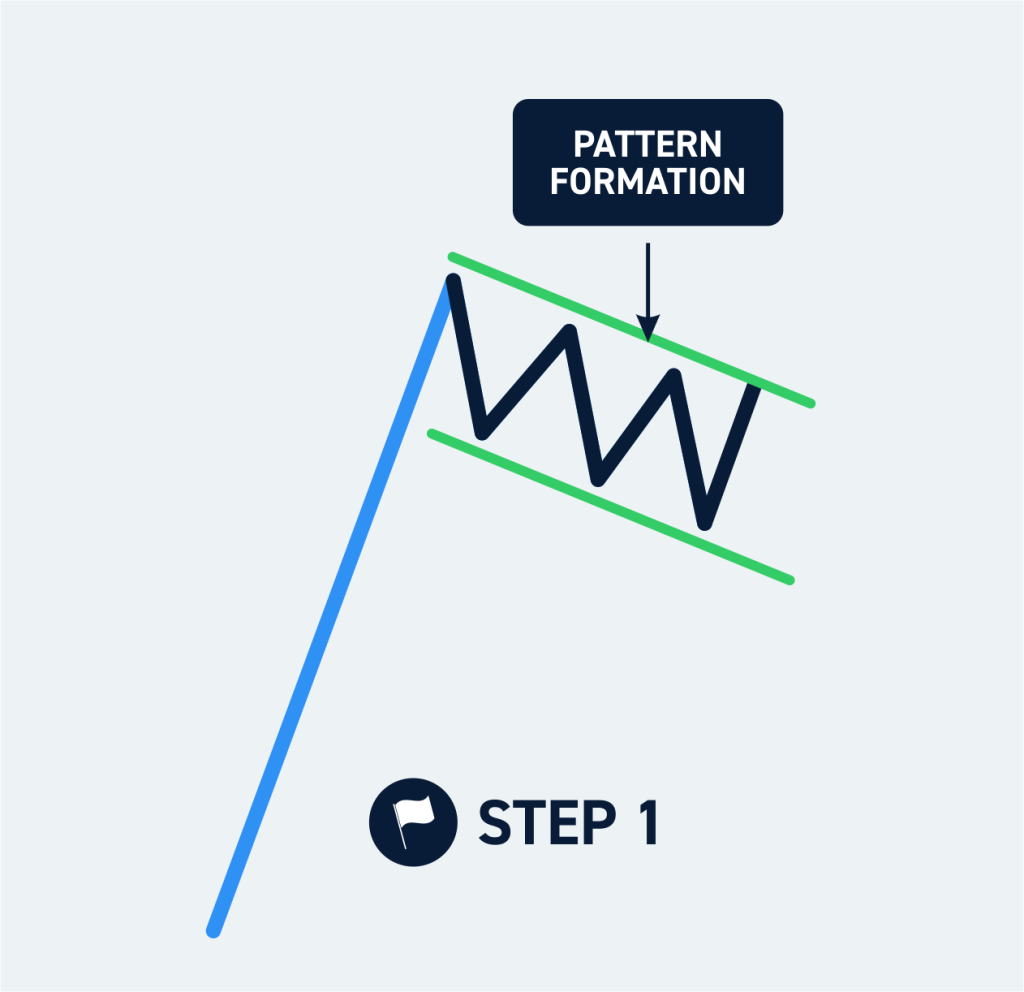
The bull flag is a clear technical pattern that has three distinct components: the flag pole, the flag, and the break of the price channel. Respectively, they show a strong directional trend, a period of consolidation, and a clear breakout structure. When put together, it can be a strong predictor of future price action.
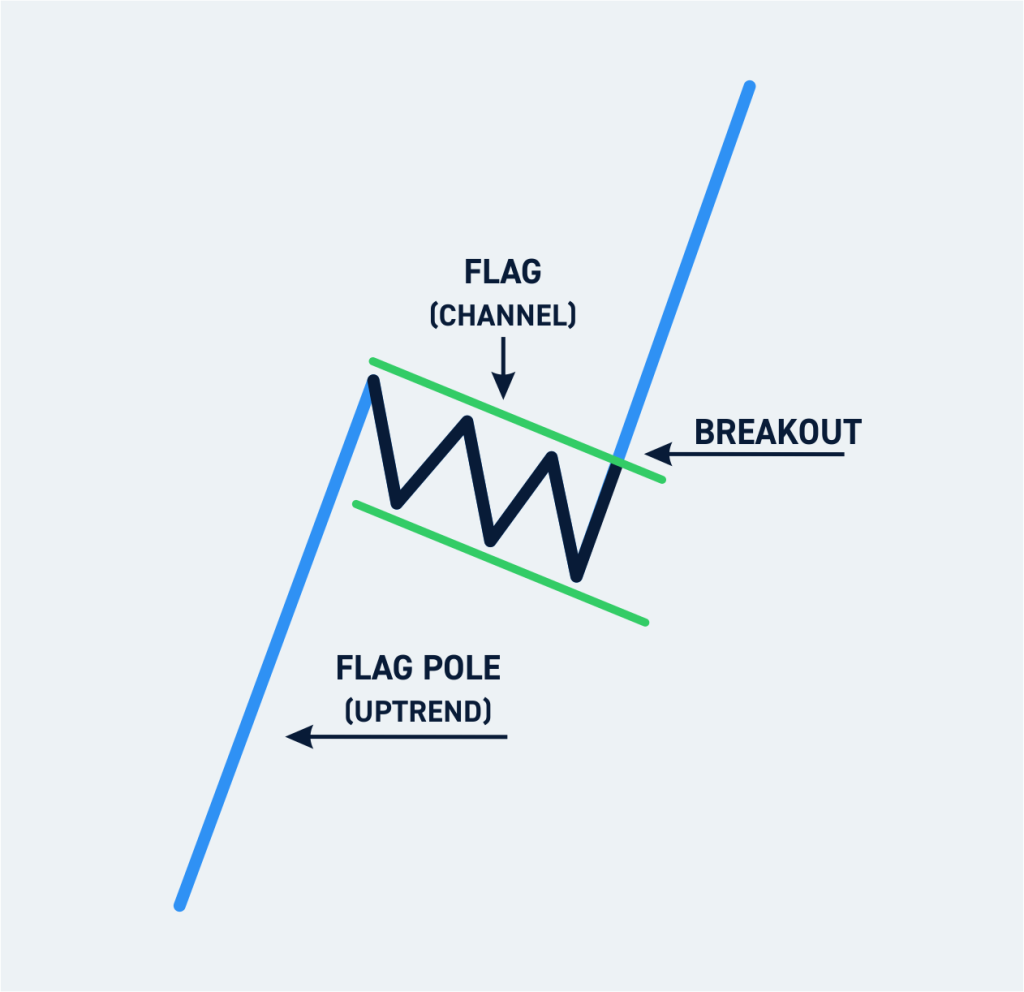
Flag Pole (Uptrend)
The first step to identifying a flag pattern is to find a steep, short-term uptrend. You can find this on any chart period, but it is vital that the move is strong, and not a slow, steady rise over a longer period. This forms the directional bias of the market.
Flag (Channel)
Following all impulsive moves in the market is either a stark reversal or a period of consolidation. The flag of this pattern is such consolidation and is what you will be looking for to find this pattern.
To draw a price channel, you need simply trade a line touching the highs and lows of a ranging market.
When you picture a flag hanging from a pole, it may be blowing in the wind, or hanging at an angle. This price channel works the same way, with the local highs and lows moving to the side, slightly downwards, or even converging!
Breakout
The breakout is where you will take your trade when using the flag pattern. After this period of consolidation and the formation of a clear price channel, the market will inevitably break out to either side. The pattern is formed only when the price breaks out to the upside, triggering another move with the greater trend.
Note: This pattern has a bearish version, the bear flag. It is identical to the bull flag, except the pole is a move to the downside, and the flag is either sideways or upward. This pattern is reliable for the same reasons.
The Psychology Behind the Bull Flag Chart Pattern
The most explosive moves in any market, (crypto, forex, stocks) are driven by pattern breakouts and trends such as flags. It is your job as a trader to identify these patterns, and turn a consistent profit!
The flag chart pattern’s strength lies in that it confirms its own bias, and moves with the larger market direction, rather than against it.
How to Trade a Bull Flag Chart Pattern
Step 1: Identify the Pattern
The most important part of the flag pattern is to identify a strong trend (in either direction, as the Flag may be inverted, triggering a bearish move!) Take a look at the higher time frames when you find a flag pole, to ensure the price is not simply ranging. It could be meeting a large area of resistance!
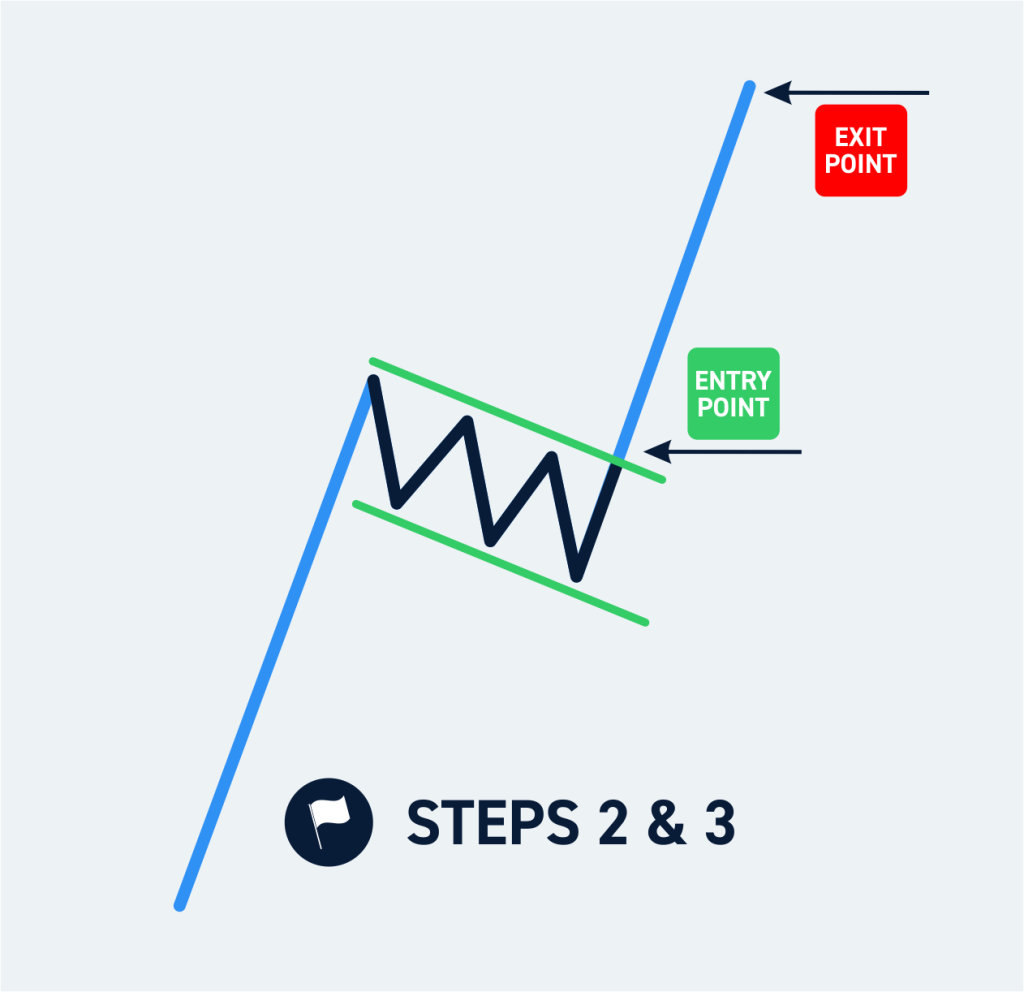
Step 2: Buy the Breakout of the Upper Trendline
The price channel of the flag stage of this pattern is a period of consolidation. This is where experienced day traders, as well as banks, are likely booking profits and exiting trades before the next big move. Consider buying the breakout of this channel if it goes in the direction of the flag pole, and only on the candle close. If it breaks out in the opposite direction, it invalidates the pattern!
In a bear flag chart pattern, this is where the price breaks below the channel, where you may open a short position.
Step 3: Close the position
No trade should be entered without knowing its exit conditions, whether this is in the trade’s favor or against it.
The stop loss is often placed at the breakout of the flag’s price channel. As traders wait for a candle close to e
nter the trade, this forms a slightly higher probability that the market will continue in your favor.
The take profit level should instead be placed at a price above the breakout point of an equal height to the previous flag pole. For example, if a security rose $10 in the flag pole, you would target $10 above the breakout point. This is one strength of the chart pattern: it has a high probability of making a similar move along with the prevailing trend.
There are no hard rules here, however! Many small-cap assets are prone to explosive moves upwards, and the chart might simply create a double-top at the previous flag pole. Traders should look into the local trading history of the asset to establish a price target for the trade. The Fibonacci pattern may be useful in targeting a higher take profit on most assets, while a logarithmic chart helps for rapidly increasing small-cap assets such as cryptocurrencies or penny stocks.
Considerations When Trading Bull Flag Chart Patterns
Keep the Context in Mind
Patterns are easiest to find in retrospect, as you can easily see the pattern’s future confirmation, unlike during live trading. While flag chart patterns are reliable technical indicators, the easiest mistake to make is to assume the flag pole is part of a prevailing upt
rend without looking at the larger picture.
For example, a day trader might find a large move on the 5-minute chart upwards, followed by a handful of candles retracing this move. However, what they might not see is that on the 30-minute chart, the price is trading sideways, limiting potential upside.
Wait for Confirmation
It may be tempting to try and guess the bottom of the price channel, and time the last bottom before the next impulsive jump. However, the market may simply continue the flag price channel for one more leg, or many more than one. This is why traders wait for the breakout in the flag pattern, rather than jumping in and making trades based on hope.
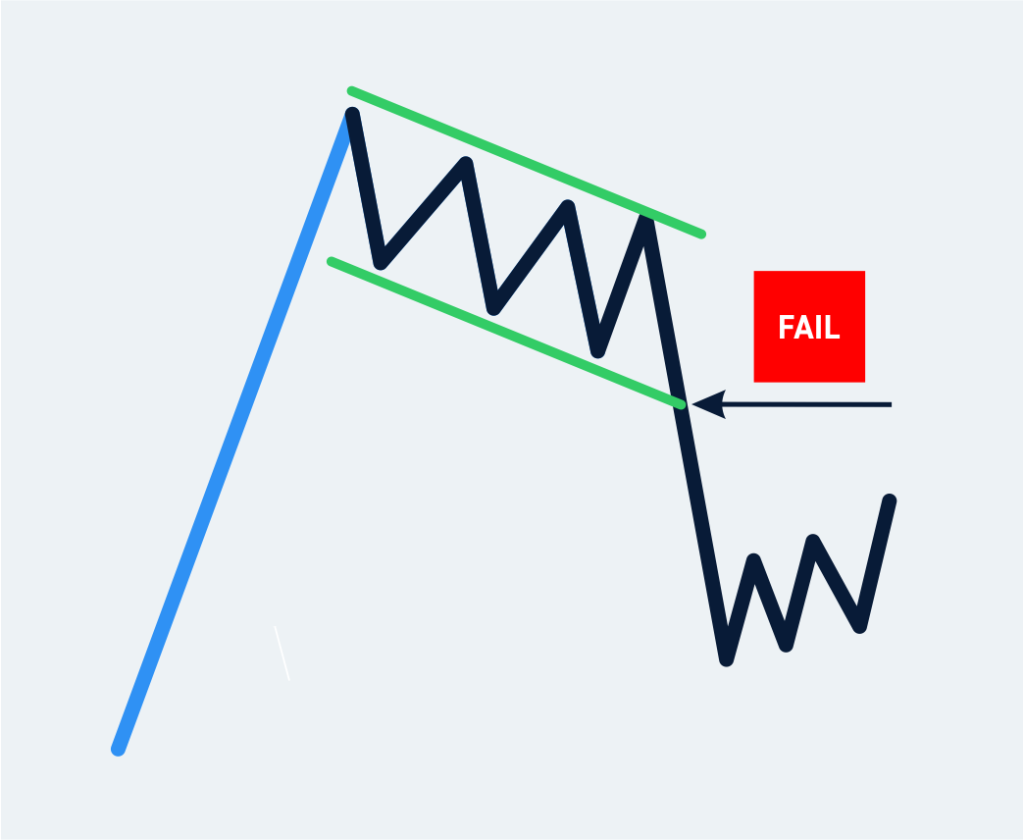
Remember, Patterns Don’t Always Work
Even with a proper breakout of the price channel, this may cause the price to be exhausted and simply continue the immediate downtrend. (Possibly retesting the previous high before falling further). No matter how reliable a pattern in history, no strategy offers 100% confidence, and the markets will eventually break every rule, at some point.
This is first and foremost why the most successful traders do not rely on a single technical pattern or indicator, and instead rely upon a confluence of them. This way, multiple arguments are in your favor backing the trade, increasing its likelihood of success!
Conclusion
The flag pattern is a frequent occurrence in the price action of all securities and can aid any trader who missed out on the initial move, letting them still capitalize on its bigger trend. Further, waiting for the end of the flag’s trend allows a greater risk-to-reward ratio and a greater probability of profit.
As profitable traders know, every indicator and strategy is about raising the likelihood of profit, so that over time, trading may turn into a reliable income stream!