You’ve likely heard traders and chartists use the term “Fibonacci” levels referencing key price support or resistance levels. Fibonacci is short for Fibonacci retracement. This is a technical analysis method utilizing ratios based on the Fibonacci sequence to determine pullback support and resistance price levels.
What is a Fibonacci Retracement?
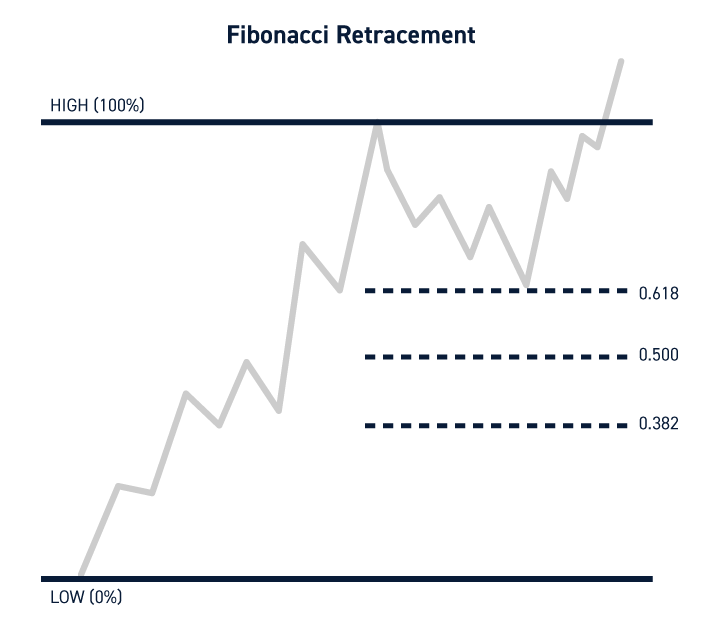
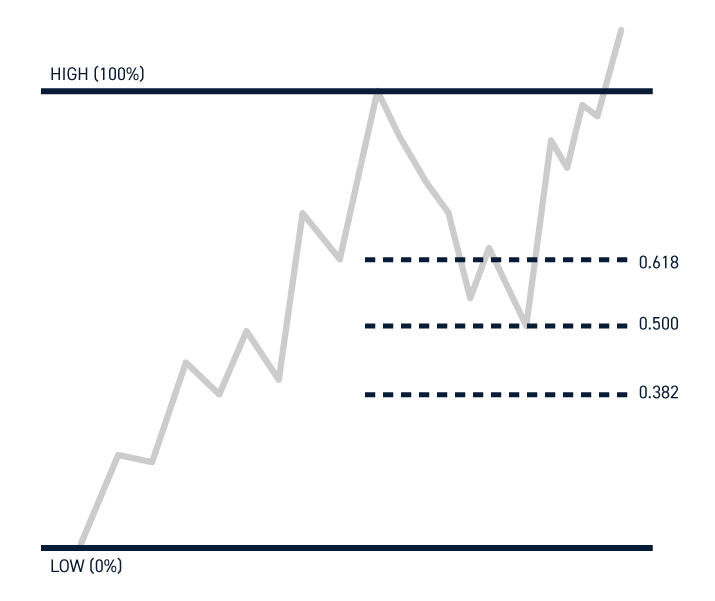
Fibonacci retracements are used to identify potential pullback and reversal points. They are static price levels that prepare you to react when they are tested. Unlike a moving average that updates a new plot with each candlestick close, Fibonacci price levels remain the same, and only change with a new high and low plot is drawn. Fibonacci price levels remain static throughout all time frames.
The retracements reveal potential areas of support and resistance ahead of time. These levels may otherwise not be visible on a chart utilizing other price indicators. The full Fibonacci series of retracement ratios are 0.25, 0.38, 0.50, 0.618, 0.786, 0.886 with 0.00 and 1.00 representing the plot point.
How Fibonacci Ratios are Calculated
Fibonacci ratios are calculated using the Fibonacci series of numbers that start with 1 and adding the number in front (EG: 1+2= 3). Adding 2 plus 3 equals 5. Adding 3 plus 5 equals 8 and so forth (13, 21, 34, etc.). By dividing the back number into the forward number or forward number into the back number, the answer is 0.618 or 1.618.
Most charting platforms will plot these levels for you, so you won’t need to do the math.
How to Use Fibonacci Retracements
Most charting platforms offer some kind of Fibonacci drawing tool. The key to Fibonacci retracements are where you start and end your plot points representing the high to low price levels.
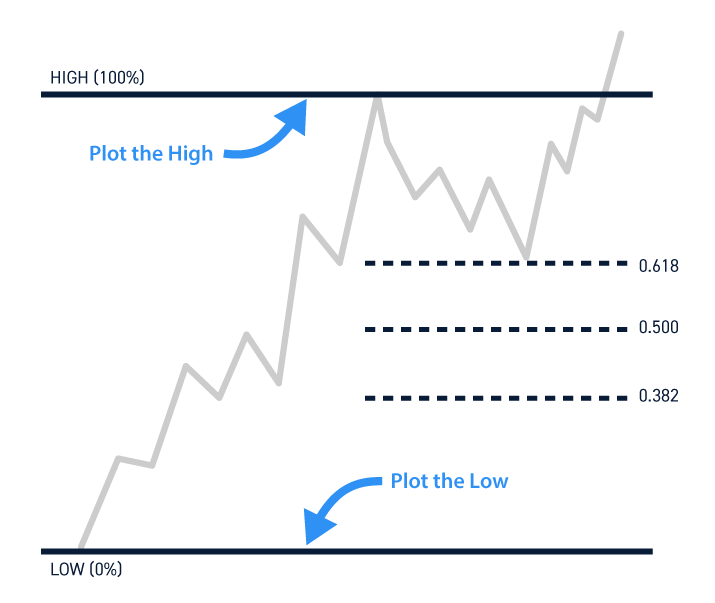
There are only two data points, the high and the low. Fibonacci levels are then automatically calculated applying the ratios to the value from the plotted high to the plotted low (EG: $25 to $35 = $10 x Fibonacci ratios) to produce lines showing the value of each ratio on the chart. Each of these lines act as a potential price inflection point.
The key is to find and plot a significant high to a significant low price. This could be the highest price on the chart to the low price on the chart or range. Intraday traders can use a 2-day high price to the 2-day low price on an intraday time frame chart (EG: 5-minute chart) to calculate Fibonacci retracement levels. Swing traders can opt for wider time frames like the daily, weekly, or monthly to plot a bigger price range, which spaces out the Fibonacci lines.
How Fibonacci Retracements Work
No stock can go up or down forever. Even the strongest up trending stocks will experience pullbacks, especially on its smaller time frames. Fibonacci retracements are a price indicator used to help traders anticipate the potential price levels where the pullbacks will find support.
There are many price indicator tools including trendlines, moving averages, pivot points, and Bollinger Bands. However, Fibonacci retracements are static and only rely on two data points (high and low) making them simple to draw, test, and use. When a stock pulls back to a Fibonacci level, it will either bounce or stall and breakdown. They act as speed bumps for price action.
Do Fibonacci Retracements Work?
The answer is, “sometimes.”
It really depends on the individual trader and how well they plot their high and low points. While nothing is 100% in trading, some traders will swear by them while some traders will write them off as bunk. This can be said about any trading tool or indicator. However, Fibonacci levels can be back-tested easily just by seeing how well the price levels react on the charts historically.
Like any technical indicator, traders should familiarize themselves with the tool and determine whether the information provided is helpful to their trading strategy.
How to Trade With Fibonacci Retracements
The first step in using Fibonacci retracements is familiarizing yourself with them.
For newer traders, figure out if Fibonacci retracements fit into your trading style. Test the Fibonacci levels by plotting them on existing stocks. Experiment with intraday time frames using multi-day high and lows. Judge for yourself how well they work alone and then add in your own indicators and methods to see if they complement your trading system.
Determine if Fibonacci retracements are appropriate for the stocks/timeframes you trade. Make sure you take plenty of notes to review if they are improving your interpretation of price action and spotting reversal price levels. Are they helping you with your entry and exits?
You will find that once you plot effective Fibonacci levels on wider time frames, they won’t have to be redrawn for months even years until the price breaks through the whole range. They are low maintenance. As you gain more confidence in Fibonacci retracements, you can continue plotting them on more stocks and continue to incorporate them into your trades.
Once you have Fibonacci levels plotted, you can use them to identify key pullback areas when trading trend reversals. There are a few levels worth paying attention to.
Capitulation Levels
The 0.618 Fibonacci retracement level tends to act as a capitulation price level where anyone who was going to stop-out of a position has been stopped out or has given up. This is what makes the 0.618 Fibonacci retracement level a prime entry point.
The 0.382 is the nominal pullback level to consider on pullbacks. This can be evident by seeing how many times the 0.618 level bounces on the stocks you plot.
To get a better idea of the underlying emotions involved, imagine you bought 1000 shares of XYZ at $10. While you expect prices to rise, they actually start to reverse on your entry. At the 0.382 (38.2%) retracement level at $6.18, you likely would stop out. However, at the $3.82 (61.8%) level, you likely gave up on the position by either stopping out washing your hands of the nightmare or just apathetically holding on assuming it’s going to zero. That 0.618 Fibonacci is a capitulation point for most longs.
The Advantages of Fibonacci Price Levels
A key benefit of using Fibonacci levels is that they only require 2 data points, unlike moving averages which can require hundreds of data points to derive a significant price level (IE: 200-day moving average). With only 2 data points, you can immediately find reversion levels for any stock just by plotting the high and the low (IE: IPOs).
Additionally, Fibonacci levels show support levels that may not otherwise be visible on a chart. Support levels are generally based off of historical trading activity, whereas Fibonacci levels are based off of a unique calculation that may allude to future trading activity.
Enhancing Fibonacci Trading
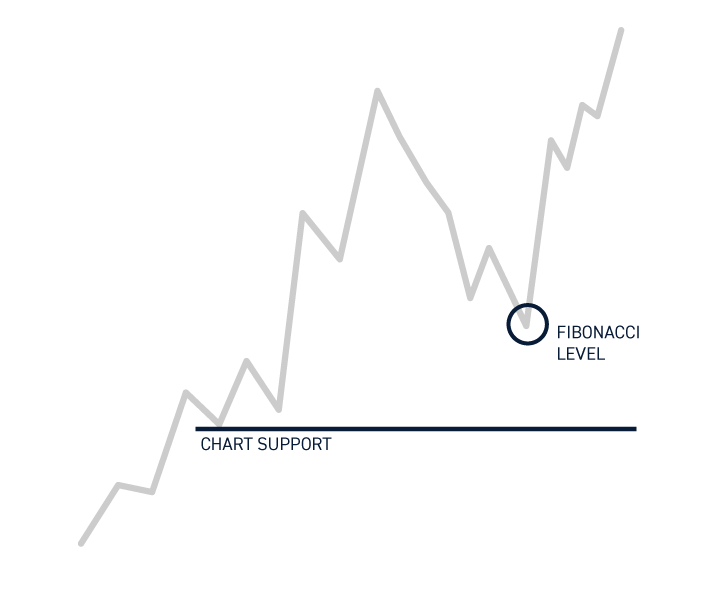
Fibonacci price levels are a tool that helps traders to identify potential reversal points of interest. A compound effect can be gained to improve performance by combining them with other charting tools. For example, a 0.618 Fibonacci level that overlaps with a 200-period moving average price level makes for an even stronger support level. Feel free to gradually add in momentum indicators like stochastic, MACD, and RSI and dynamic price indicators like moving averages. The key word here is gradually, so you can acclimate to implementing and using them comfortably.