Every time the stock market goes on an extended bull run, fears of a bubble begin to creep in. Stock market bubbles have the potential to wipe out enormous gains when they pop. So, it’s important for traders to be able to recognize them and to know how to trade when a bubble is present.
In this guide, we’ll explain how stock market bubbles commonly work, how to spot the likely signs of a market bubble, and how you can approach trading in the midst of a bubble.
What is a Stock Market Bubble?
A stock market bubble occurs anytime the value of the stock market grows out of control. During a market bubble, the valuations of many companies expand beyond what many investors would consider reasonable.
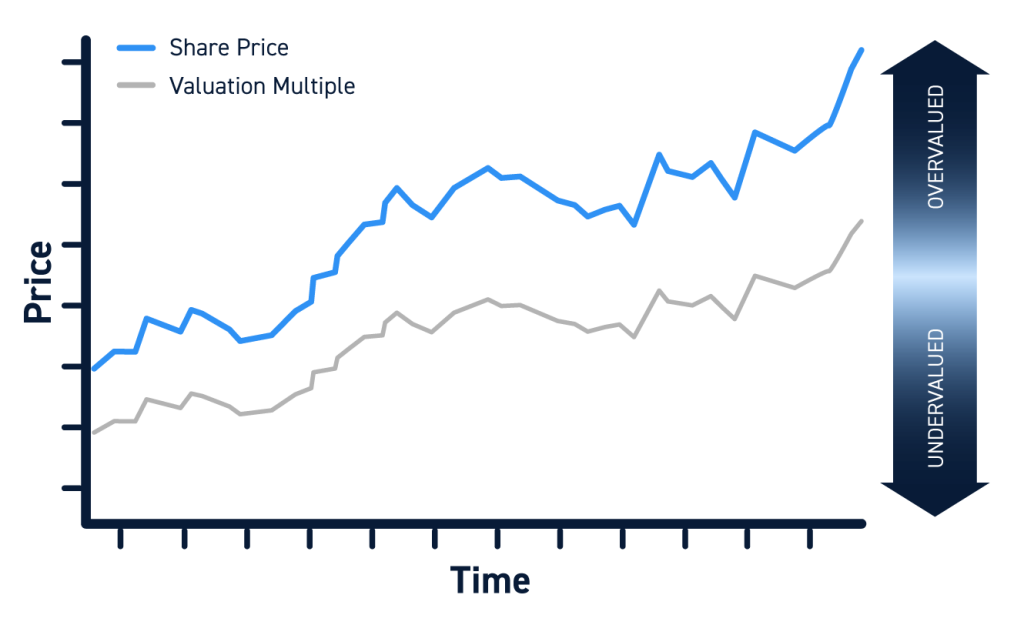
This situation is referred to as a bubble because it typically grows slowly over time as share prices and valuations rise. Then, like a bubble popping, the market falls rapidly and all at once.
When a market bubble pops, the decline can be a short-lived correction back to more sustainable price levels or the beginning of a long-term bear market. Whether the decline is temporary or lasting largely depends on broader economic conditions.
How Does a Stock Market Bubble Happen?
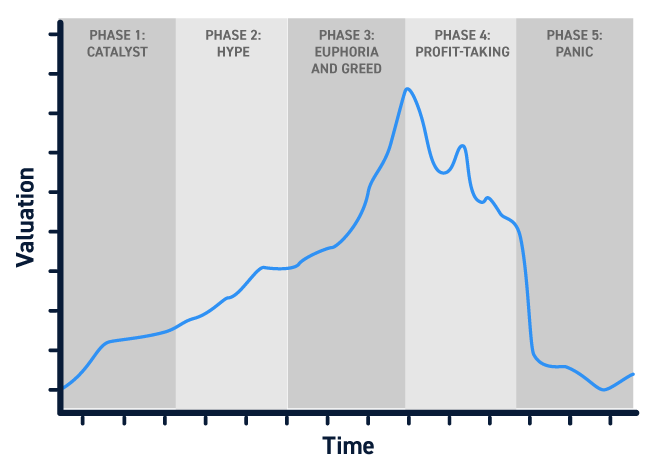
Stock market bubbles follow a common cycle with five phases:
Phase 1: Catalyst
During the catalyst or trigger phase something new and exciting kicks off a round of investment. The catalyst can be the development of a new industry (for example, the growth of the tech industry) or a widespread shift in the economy (for example, the COVID-19 pandemic).
Phase 2: Hype
During the hype phase, news of the catalyst spreads and people begin to invest in the market, pushing prices higher.
Phase 3: Euphoria and Greed
As early investors see strong returns, they double down and encourage their family, friends, and colleagues to invest. This in turn encourages more people to pile into the market with increasing amounts of money.
At some point, prices begin to rise past a reasonable point. But investors ignore this since they are continuing to reap returns as more people enter the market. It is at this point that a market bubble has fully formed.
Phase 4: Profit-taking
The profit-taking phase occurs as the bubble is nearing its end. Investors begin to get nervous about sky-high prices and begin selling some or all of their holdings to realize their profits. In some cases, the profit-taking phase may be kicked off by negative catalysts, such as weak earnings or economic reports.
Phase 5: Panic
The panic phase is when a market bubble pops. Once profit-taking begins, prices start to drop. That induces panic among investors who are still heavily invested in the market, and they start to sell. As the pace of selling picks up, panic sets in and there is a rush among investors to sell, causing prices to plummet.
Examples of Stock Market Bubbles
There have been a handful of stock market bubbles in recent history.
One of the most well-known is the dot-com bubble, which occurred from around 1995 to 2002. The catalyst was the development of internet companies, and euphoric buying drove the NASDAQ up from 1,000 in 1995 to more than 5,000 by the time profit-taking and panic selling set in.
The onset of the Great Depression was also the popping of a stock market bubble. From 1921 to 1929, the Dow Jones Industrial Average grew by nearly 500%. The bubble’s popping was swift and severe – by mid-1932, the index had fallen below its 1921 level.
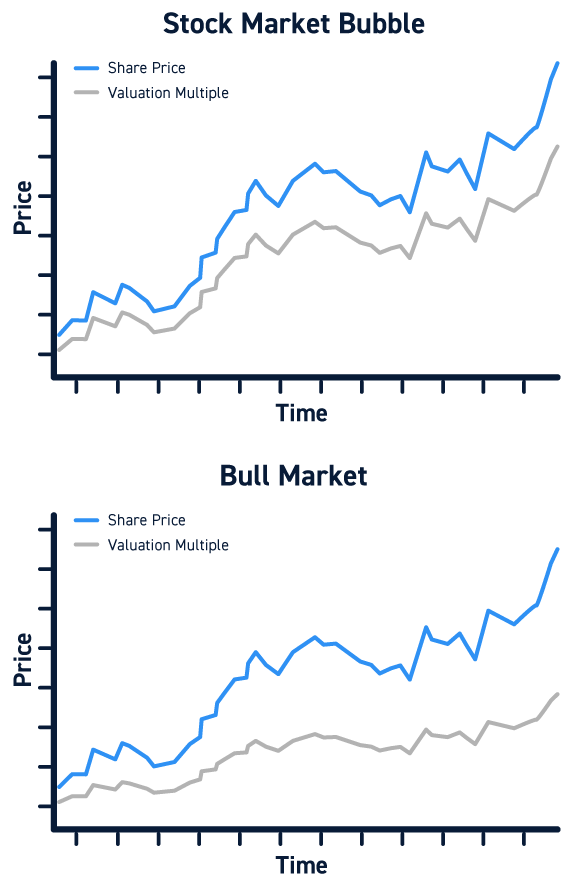
Stock Market Bubbles vs. Legitimate Bull Markets
It can be difficult to differentiate a stock market bubble from a legitimate bull market that is driven by fundamentals rather than euphoria. However, there are a few indicators that traders should look for.
First, it’s important to determine what is driving the market forward. Real growth in businesses – in revenue, profits, and markets – is the foundation of a lasting bull market. Widespread hype over businesses that have not fundamentally advanced is a sign of a forming bubble.
In addition, traders should consider what investors generally are expecting in terms of future growth. Slow and steady growth is much more likely to be sustainable than exponential growth. If investors expect ever-accelerating growth, they’re likely to be disappointed eventually and that can set off a wave of selling.
How to Spot a Stock Market Bubble
The best way for traders to spot a stock market bubble is to look for signs of hype, euphoria, and greed.
If growth expectations for many companies are increasing while the performance of those companies isn’t, it’s likely that investors are in a state of euphoria. Unrealistic valuations – indicated by high price-to-earnings and price-to-sales ratios – are a strong indicator of a bubble.
Traders should also watch out for more people piling into the market. A bubble may be likely if many people who have not invested before or who are investing solely based on emotion begin buying stocks.
How to Trade During a Stock Market Bubble
Stock market bubbles can present many opportunities for trading, especially since stocks are often highly volatile during the hype and euphoria phases of a bubble. Bubbles can continue expanding for a long time, and they often last far longer than market observers expect.
However, it’s important for traders to be aware of the bubble and to know that it is likely to pop at some point. Especially as valuations reach unreasonable levels, traders may want to consider minimizing their overall risk by limiting the amount of money they’re trading with at any time or reducing the timescale of their positions.
Conclusion
Stock market bubbles form when investors enter the market and drive up prices beyond reasonable or sustainable levels. When a bubble pops, the decline in prices can be rapid and significant. For traders, it’s important to be aware of the signs of a bubble and to tread carefully in the market as a bubble grows in size.