A popular quote in trading is, “The trend is your friend.” This means it’s prudent to play in the direction of the price trend in order to let your winners ride. There are many tools traders use to visualize trends. One of the most widely used tools are known as trendlines.
What is a Trendline?
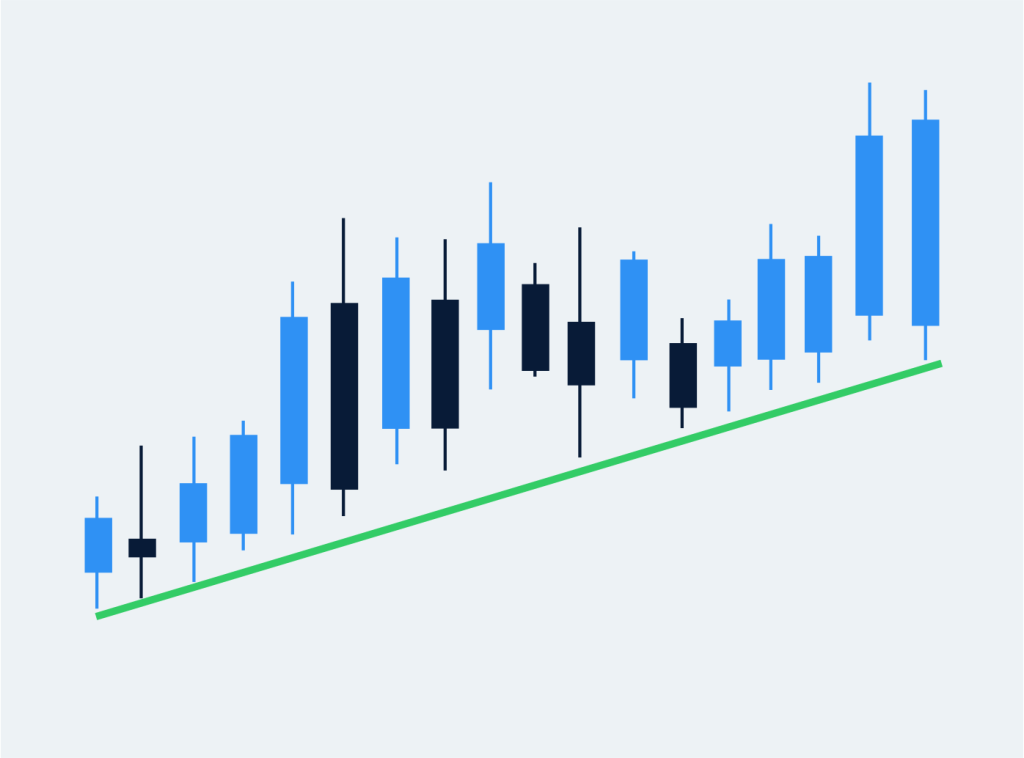
Trendlines are straight lines connecting key price levels to visualize the direction of the price trend. They can be horizontal or diagonal and are usually viewed from left to right on a price chart.
Trendlines are used to visually gauge support and resistance price levels and the trend, whether it is up, flat, or down. They can be a bit subjective based on where you start and end the plots as well as the particular chart time frame used. Unlike moving averages, trendlines don’t take any averages into consideration. It’s purely a visual indicator.
How to Draw a Trendline
Trendlines are drawn on a price chart, usually using candlestick or bar charts.
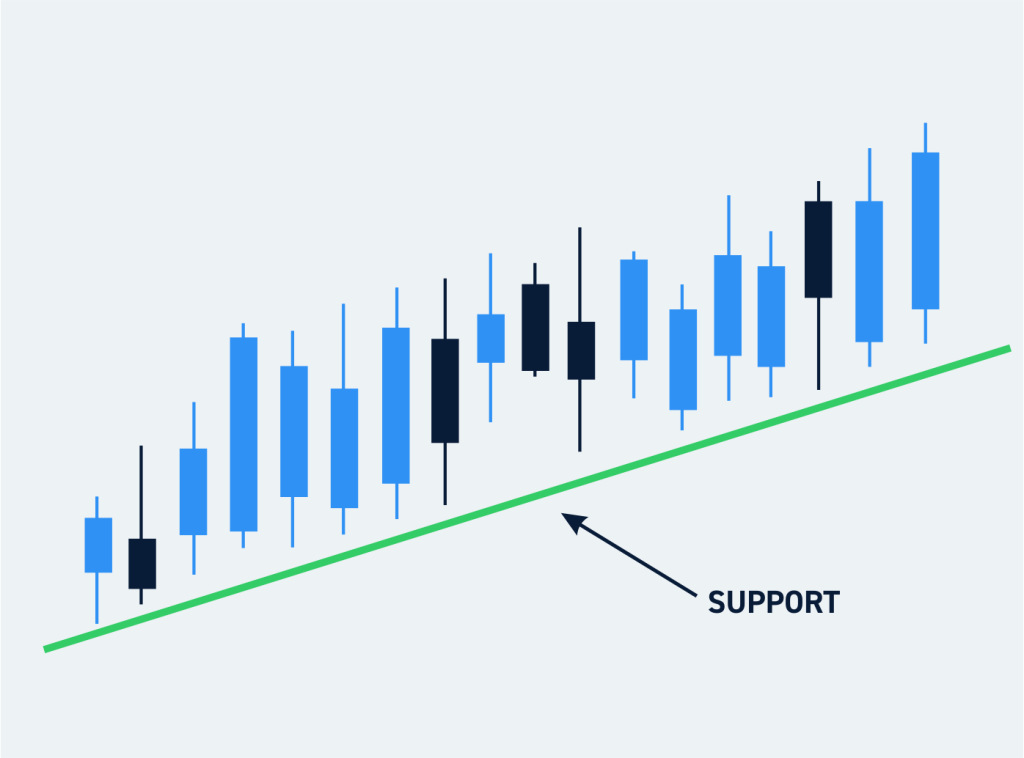
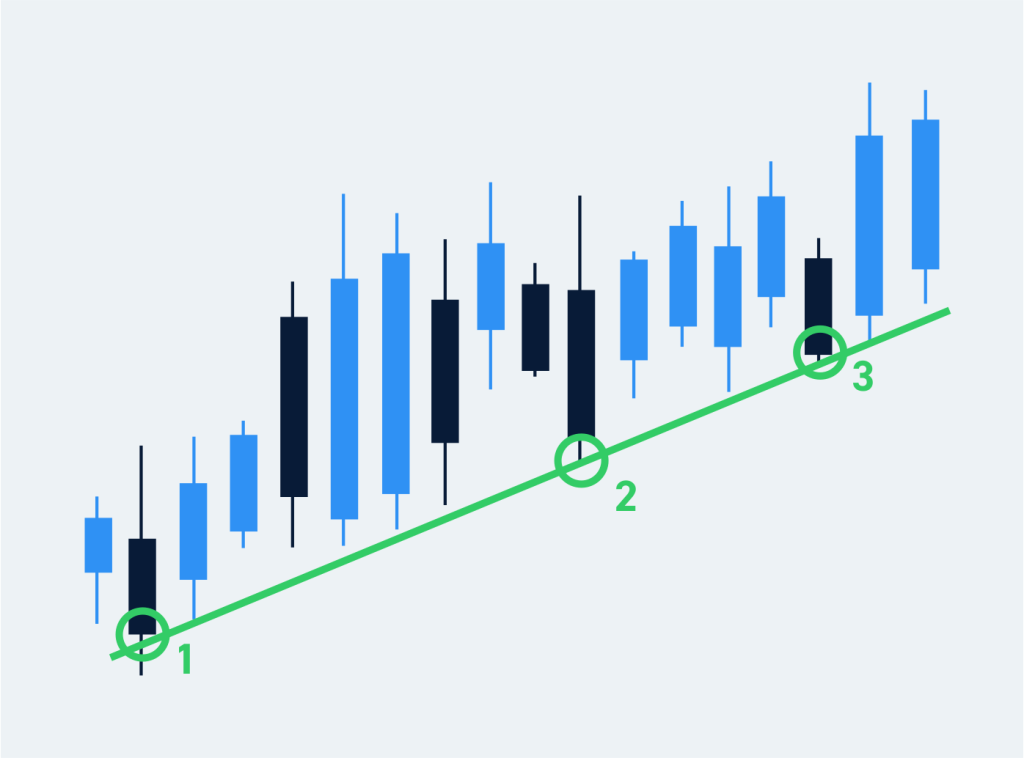
You can draw a trendline for an uptrend by connecting the lows on a price chart. The trendline acts as a proven support level since prices have consistently bounced off the trendline.
On downtrends, you can draw a trendline by connecting the tops, which act as a downtrend resistance level.
Most charting platforms enable the trader to manually draw trendlines usually under the drawing tools. Some charting platforms may provide automatic trendlines plotted the software. Unless you understand the rationale for using that particular set of plot points, you are better of drawing them manually.
How Significant is a Trendline?
The significance of a trendline depends on the number of touch points. Trendlines that have more touch points turn out to be more significant, as other traders have eyes on the same levels. It illustrates how strong a trend is when the touchpoints hold.
A strong trendline will deflect any tests of the touchpoints and continue to drive the trend. It becomes a bit of a self-fulfilling prophecy as the more times the touchpoint holds, the stronger it appears. On the flipside, prices can reverse quickly if the trendline breaks.
Trendlines vs. Channels
Trendlines are single lines that either represent support (uptrend) or resistance (downtrend)
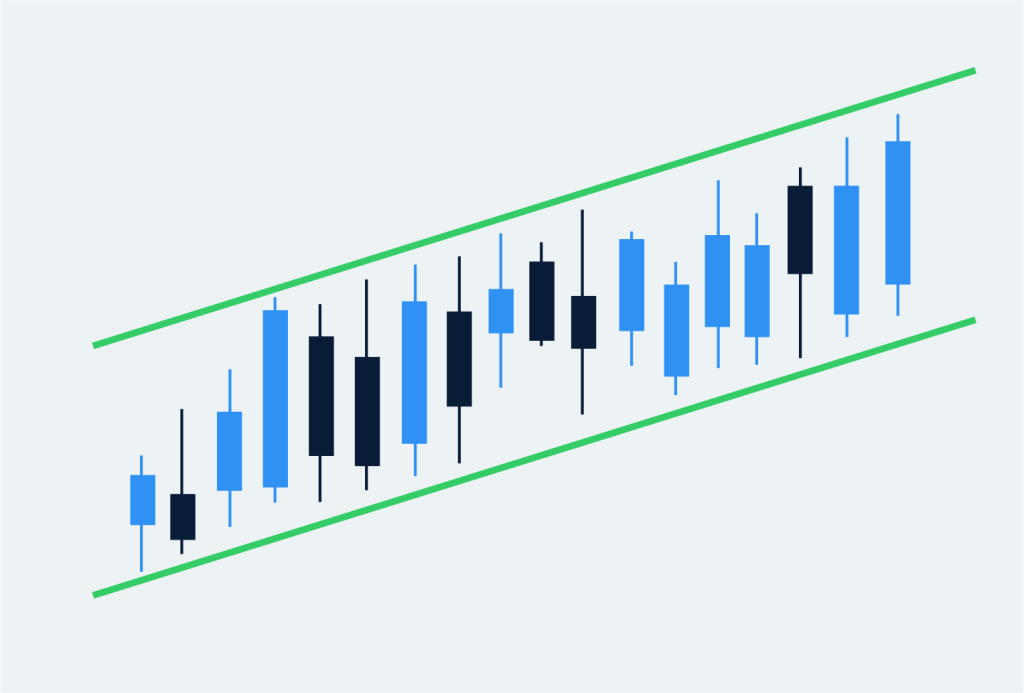
Channels incorporate two trendlines (often parallel) that represent a trading range. Channels can be used to identify trading ranges and key support/resistance levels within those ranges.
How to Use Trendlines Properly
As with any technical analysis tool, trendlines visualize the price action. They illustrate the historical direction of the trend along with support and/or resistance levels to help traders anticipate where the price is going. They can be used for entries on pulls back and stops on breaks.
Here are some ways you can use trendlines effectively.
Use Trendlines That Are Relevant to Your Trading Timeframe
The chart time frame used can change the trendlines. In other words, a stock may have different trends across different trendline.
For example, a stock XYZ may be clearly uptrending on a 60-minute time frame, but downtrending on the 5-minute time frame. The first thing to do when using trendlines is to establish which timeframes you will be prioritizing for your trades. Intraday traders may use any combination of time frames from the 1-minute up to the 60-minute. Swing traders will usually utilize the 60-minute to the monthly times frames.
Use Trendlines for Support/Resistance
The trendline can be used as a support level in an uptrend. The trendline should be rising and deflect any tests on pullbacks to bounce it higher. Traders looking to enter an uptrend can watch for pullbacks to the trendline to find an entry on the pullback, either on the test of the trendline or the bounce off of the trendline.
The reverse holds true for downtrends where short-sellers can look to enter short positions on reversions back to the falling trendline. The trendline can be used a stop-loss area if it breaks. Using trendlines can make for good entry and exit levels.
Use Trendlines to Identify Trend Reversals
Traders can also use the trendline for trend reversals such as breakouts and breakdowns. An uptrend can breakdown if the price falls below the trendline and fails a bounce attempt back up at the trendline. A breakout occurs when the price bounces through the falling trendline and holds the pullbacks above the trendline.

As the price continues to move in that direction, the trend reverses as the trendline is pulled in the direction of the price. These also make solid entry and exit price levels for traders looking to play breakouts and breakdowns or maintain stops at those levels.
Trade With the Trend
The trend is your friend. Utilizing trendlines enable you to trade with the trend utilizing the trendline for both entries and exits. To provide more clarity, you can consider using two trendlines to trade within the channels. This involves drawing an upper trendline with touchpoints between the highs and a lower trendline with touchpoints between the price lows.
Traders can trade oscillations between the trendlines by buying or covering at the lower trendline on the bounce and selling or shorting at the upper trendline on the reversal. The wider your timeframe is, the larger you trend channel should be. The key is making sure to allocate the correct number of shares to stomach and manage the swings.
Give Yourself Wiggle Room
Don’t fall for one of the common problems when trading with trendlines, entering and exiting too soon. Many traders will immediately stop-loss when the trendline is tested or overshot, then regret the exit as the trendline eventually holds as the price reverses back in the direction of the trend. It’s easy to get wiggled out of trends by moving too quickly.
It’s prudent to give yourself wiggle room so you don’t get shaken out prematurely on the trend. The wider time frames require more wiggle room. For entries, you can also wait for the reversal to enter or scale into a position at various points including the trendline test, overshoot, and reversal. Additionally, you can add a momentum indicator like a stochastic or MACD to provide an overbought or oversold gauge to time your entries and exits in relation to the trendline.