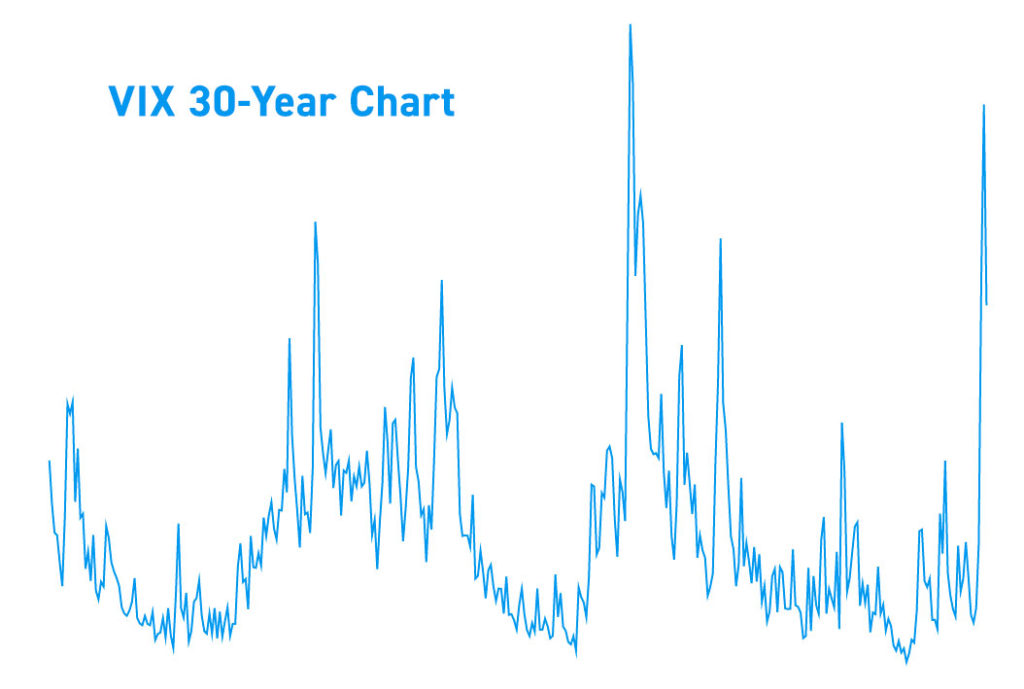
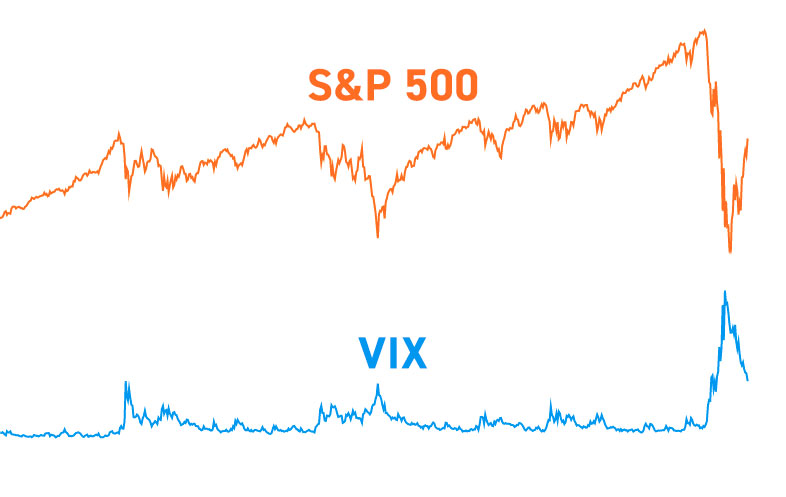
When stock markets plunge hard and fast, financial media headlines often report on the “spike” in the VIX. The CBOE Volatility index (VIX) is a market index on the Chicago Board of Exchange (CBOE) that measures the implied volatility of the S&P 500 index (SPX) options. It’s calculated as the expected change in the S&P 500 index for the next 30-day period based on call and put options and the risk-free interest rate of U.S. treasury bills. The VIX has become synonymous with falling stock markets. It usually moves inversely with the S&P 500 index, but not all the time.
What Is The VIX Index?
The VIX is a measurement of the forward expected volatility of the S&P 500 index. Originally introduced as the Sigma Index by authors Benner and Galai in 1987 to be a volatility index.
In 1993, Vanderbilt University Robert Whaley, in collaboration with the Chicago Board of Exchange (CBOE), helped develop and launch the real-time reporting of the VIX. The VIX itself (being an index) was not directly tradeable. This changed in 2004 when the CBOE launched the VIX futures for trading. In 2006, CBOE rolled out options trading in the VIX. Afterward, various levered exchange traded funds (ETFs) and exchange traded notes (ETNs) were developed for traders to directly trade VIX correlated (positive and negative) instruments.
What Does The VIX Measure?
Often referred to as the fear gauge or fear index, the VIX technically represents volatility, not direction. The VIX usually carries an inverse relationship or negative correlation with the SPX. When the SPX rises, the VIX tends to fall and vice versa. However, the VIX can also have a positive correlation with the SPX (IE: SPX falls, and VIX falls). This can happen when the SPX slowly declines after a period of huge volatility. As volatility calms down, the VIX loses value despite the SPX continue to fall lower. Therefore, it’s very important not to assume that negative correlation always exists.
Volatility measures the magnitude of price fluctuations for a specified period of time. The VIX attempts to gauge the volatility expected for the next 30-days for the S&P 500. This forward expectation is referred to as implied volatility (IV). To best gauge forward expectations, the VIX is formulated using the market prices of the SPX options with front month contracts with more than 23 days until expiration and next-month contracts with less than 37 days until expiration.
How To Trade The VIX
While the VIX index can’t be directly traded (just as you can’t trade the Dow Jones Industrial Average (DJIA)), there are ETFs that track and mirror the VIX, which can be traded. Many of these ETFs and ETNs carry additional risk through embedded leverage and an eroding cost structure.
It’s crucial that traders don’t assume the VIX always correlates directly with the SPX. It’s a volatility measure first and foremost; therefore, VIX can spike up when the SPX goes from low volatility to high volatility spikes to the upside. This misunderstanding has caused many traders to blow out their accounts, assuming the VIX is a directional tool and must revert back to negative correlation with the direction of the SPX. While negative correlation usually exists with the SPX, traders must have the agility to spot when that correlation fades. This is especially crucial if using it as a hedging tool to offset long positions.
How To Trade The VIX With ETFs
The most widely traded VIX ETF is the ProShares Trust Ultra VIX Short-Term Futures ETF (NYSEARCA: UVXY). This ETF carries 2X leverage that tracks the one-day performance of the VIX futures. With that in mind, it’s crucial to understand this levered ETF is structured only to track the one-day performance of the VIX. This ETF’s counterpart, (NYSEARCA: SVXY) inversely tracks the performance of the VIX (allowing traders to “short” the VIX by taking a long position in SVXY).
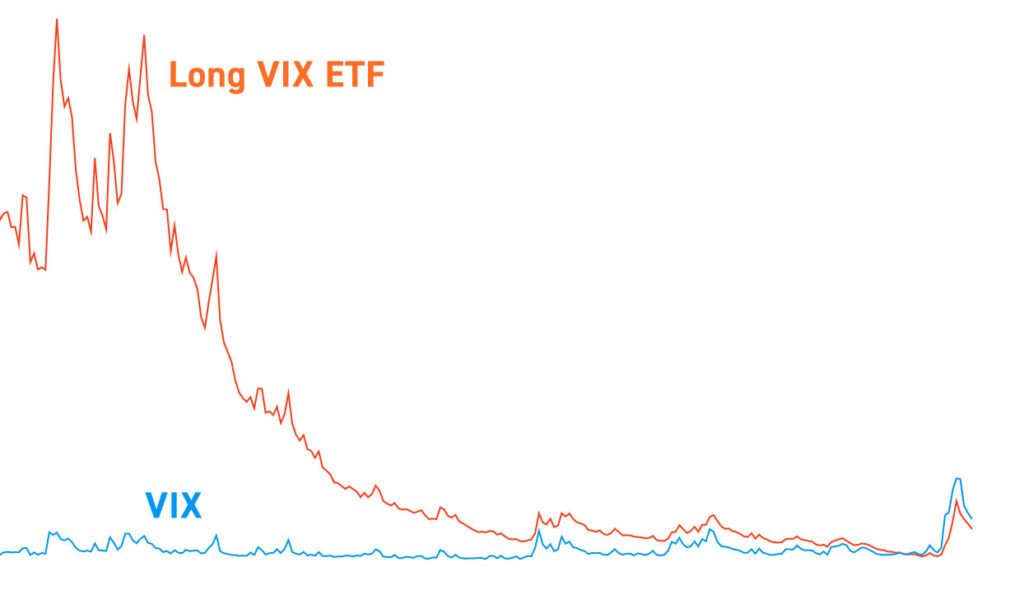
Leveraged ETFs (especially short/inverse ETF’s) are not to be held long-term since they suffer from erosion, inversion, and contango. Any or all three of these factors can severely disrupt ETF pricing and throw traders into a conundrum.
Contango And Time Decay
A common misunderstanding of the UVXY leads to a rude awakening when investors would experience the UVXY falling even when the SPX sold off over time. This is due to price gaps that erode the valuation since tracking is reset every morning. Underlying VIX futures can experience contango even when the VIX is flat.
Contango occurs when futures trade at a premium to the spot price ahead of expiration. Exchange traded products can’t be rolled over like futures; instead they undergo rebalancing that causes symptomatically triggers purchases at higher prices while selling at decayed lower prices. This, along with slippage from gaps, can result in monthly erosion ranging from eight to 13-percent on average per month. This means holding these ETFs for more than a few days to weeks is a losing proposition. Limiting exposure to intraday properly aligns with the purpose of the VIX Exchange Traded Products.