Volume is a key metric that every trader should be aware of. While trading volume on its own is informative, relative volume is particularly important for trading. Relative volume can indicate when trading interest in a stock is high or low and it may provide signals about liquidity and volatility.
In this guide, we’ll explain what relative volume means for stocks and why traders should pay attention to relative volume.
What is Volume in Stocks?
Trading volume in stocks is a measure of how many individual shares of stocks are traded over a particular period of time. Volume is usually measured on a daily basis, but it can also be measured hourly or monthly.
There are also alternative measures of volume, such as the number of trades placed in a stock or the total dollar-volume of a stock traded. Looking at the total number of trades can be useful if a few large trades are driving share volume higher. The dollar-volume of a stock traded can be useful for comparing volume across stocks that have different prices per share.
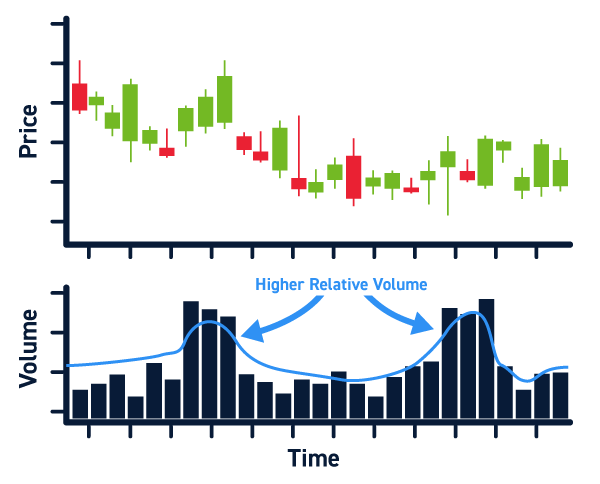
What is Relative Volume in Stocks?
Relative volume compares the current trading volume in a stock to the trading volume over a specific reference period. For example, relative volume might compare the current day’s trading volume to the average daily trading volume over each of the past 10 days. In that case, relative volume would be calculated as:
Relative Volume = Current Day’s Volume / (Total 10-day Volume / 10)
Or, more generally:
Relative Volume = Current Volume / Average Volume
If a stock’s relative volume is greater than 1, it means that the current day’s trading volume is greater than the average volume over the past 10 days. A relative volume of 5, for example, means that the current trading volume is 5 times greater than the average volume.
If its relative volume is less than 1, it means that the current day’s trading volume is less than the recent average for that stock. A relative volume of 0.5, for example, means that the current trading volume is half as much as the average volume.
Why Does Relative Volume Matter?
Relative volume is important for traders because it provides important insight into what’s happening in the market for a stock. There are 3 main pieces of information that relative volume provides.
Liquidity
In general, greater trading volume means that there is more liquidity in a stock. So, high relative volume (that is, relative volume significantly greater than 1) signals that a stock is likely to be highly liquid. On the other hand, low relative volume (significantly less than 1) means that there may be little liquidity in a stock.
This is important for traders because liquidity is essential to moving in and out of positions quickly at favorable prices. Stocks with low liquidity – which may be signaled by low relative volume – may have high bid-ask spreads and it is possible to be unable to exit an open position.
Relative Trading Interest
Relative volume also provides information about the interest in a stock among traders. High relative volume signals that there are more shares of a stock being bought and sold than is typical.
Unusually high interest in a stock is often preceded by a catalyst, such as an earnings report, market news, or insider buying and selling. These catalysts can provide opportunities for trading, and searching for stocks with high relative volume is one way to find them.
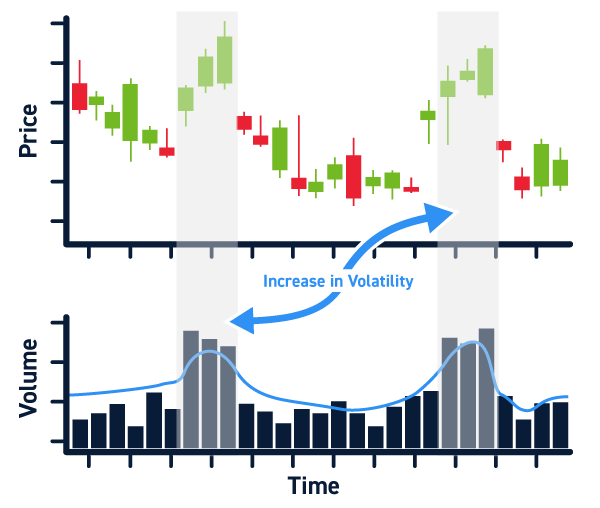
Volatility
High relative volume can also be an indicator of brewing volatility. For example, say a stock typically moves up or down $0.50 in a day on 1 million shares of volume. If on another day 5 million shares of the same stock are traded (a relative volume of 5), that could move the stock $2.50 in one direction.
Importantly, high relative volume doesn’t necessarily cause increased volatility. Trading volume accounts for both the buying and selling of shares, so any price movement will depend on the balance of buyers and sellers in the market for that stock. By the same token, a relative volume of 5 could see a stock move $2.50 in one direction, or it could see the same stock move $5.00 in one direction.
Additional Considerations around Relative Volume
An important thing to keep in mind when evaluating relative volume is that it looks only at the total number of shares being traded. It does not take into account who is trading those shares or whether trading volume is being inflated by a small number of very large trades. It’s a good idea to also compare the number of trades against the average number of trades in a stock to check whether volume is being affected by institutional block trades.
As we noted above, relative volume also doesn’t provide information about the balance of buyers and sellers for a stock. Relative volume can be associated with high volatility if buyers and sellers are unbalanced, or it can be associated with very little volatility if buyers and sellers are equally matched.
Conclusion
Relative volume is an important tool that traders can use to quickly evaluate whether trading interest in a stock is above or below average. Stocks with high relative volatility may offer more opportunities for trading, especially if there is an associated increase in liquidity and volatility.